About AQS Data
This document is an overview of the structure and contents of the EPA’s Air Quality System (AQS) database. It answers questions many first-time data users have about the availability of data, the geographic and temporal scope, and how its organized and processed. Please note the caveat emptor at the end of this document.
1 Introduction
The Clean Air Act requires that state, local, and tribal air pollution control agencies monitor the air for ambient levels of certain pollutants. This data is useful for health and policy research relating to air pollution and its control (Fann et al. 2015). The requirements for the monitoring program are codified in 40 CFR Part 58. In addition to the required monitoring, many agencies perform additional and/or voluntary monitoring of substances and meteorological parameters. The monitoring program is designed to meet three objectives (40 CFR Part 58 Appendix D.1):
Provide air pollution data to the public in a timely manner;
Support compliance with ambient air quality standards and emissions strategy development; and
Support for air pollution research studies.
This data is reported to the United State Environmental Protection Agency (EPA). The monitoring agencies are required to report the measured data, along with metadata about the site and monitoring equipment and associated quality assurance data to the US EPA’s Air Quality System (AQS). AQS and its predecessors have been accepting and storing this data for more than 50 years and currently contains more than 3 billion measurements. This document describes (1) the methods by which the data can be obtained, (2) the general nature of of the AQS data set, and (3) some background material about the monitoring program that may help users select and interpret data.
2 Accessing the Data
This section summarizes the different ways you can access EPA’s air quality data.
2.1 AirData
EPA’s primary portal for public access to air quality data is the AirData website. This website has reports, graphics, and maps that can be customized by the user. Most AirData tools show only criteria pollutants. AirData is suitable for use by citizens interested in their local conditions or policymakers and researchers looking for the data they need.
2.2 The AQS API
Within AirData, the AQS API (application programming interface) is available for querying data. The API is a suite of REST web services allowing users to customize data queries to select only the data they need. It provides access to all data within AQS (and not just criteria pollutants). Users must obtain a key before uing the API and detailed instructions for use are available at the API site. In 2019 the API was revised to add many more services, including: daily and annual summary data, site and monitor descriptions, and quality assurance data and other “helper” services like lists of values and column definitions.
The AQS API is suitable for use by people who are familiar with the monitoring program and understand how the EPA collects and organizes data. The remainder of this page is a primer on the topic.
2.3 Data Files
EPA also posts files of data at AirData for the convenience of users who would like large sets of the data without having to use the API. The files are organized by parameter (or parameter class), temporal aggregation level, and collection year. The temporal aggregation levels are hourly, 8-hour (for ozone), daily, and annual. Each file contains all data for the nation.
These files are updated two times per year, nominally in May and November. The May update is intended to be the first complete set of data for the prior calendar year. The November update is intended to be the first complete data set for the ozone season of the current year. Keep in mind that given the submission schedules, allowable resubmission windows, etc. that more data may arrive or the posted data may change after it is initially released. Each file has a “last update date” which will be updated if, during the regular update cycle, any data in the file has been added or changed.
The data files are suitable for use by people who are familiar with the monitoring program and understand how the EPA collects and organizes data and are comfortable handling large (multi-million row) data files.
2.4 Real Time Data
Real time data (data collected today) is not available from AQS (see the timeliness of data section below). If real-time information is needed, please visit the AirNow API site and direct all questions there. The information in this document does not apply to the AirNow system.
2.5 Toxics Data
Toxics Data (also called HAP or Hazardous Air Pollution Data) is available from all of the sources listed above. However, it is suggested you get toxics data from the EPA Toxics Archive. This is a value added product that includes data from sources other than AQS, has additional EPA-applied quality assurance, and has less stringent data reduction policies (e.g., rounding) applied. Toxics data is included in the sources above for those needing it in a consistent format with the other outputs.
3 The AQS Data Set
This section provides a statistical abstract of the data available in the data set. The three dimensions appropriate to a discussion of the data set as a whole are time, geography and parameter.
3.1 Time
The earliest sample in the data set is from 1957. From that time the number of parameters sampled and the frequency at which they are sampled has generally increased. Changes in regulatory and health focus has caused variability in the numbers of monitors in operation over time. Table 1 shows the number of monitors operating, the number of distinct parameters sampled, the number of operating monitors, and the number of individual samples over time for the data set.
Year |
Parameters |
Monitors |
Sample Measurements |
|---|---|---|---|
1957 |
19 |
369 |
9,175 |
1958 |
25 |
737 |
47,653 |
1959 |
25 |
618 |
45,970 |
1960 |
26 |
1,010 |
52,255 |
1961 |
26 |
1,068 |
74,405 |
1962 |
29 |
1,348 |
230,012 |
1963 |
30 |
1,510 |
826,563 |
1964 |
30 |
2,355 |
997,277 |
1965 |
33 |
4,116 |
1,279,624 |
1966 |
52 |
5,233 |
1,608,604 |
1967 |
53 |
6,759 |
1,983,060 |
1968 |
69 |
10,276 |
2,859,647 |
1969 |
65 |
10,694 |
3,078,881 |
1970 |
53 |
9,018 |
3,020,440 |
1971 |
66 |
10,749 |
5,661,916 |
1972 |
73 |
14,365 |
8,729,757 |
1973 |
88 |
16,848 |
12,433,216 |
1974 |
87 |
19,883 |
17,702,113 |
1975 |
84 |
24,826 |
24,096,286 |
1976 |
83 |
22,935 |
25,358,854 |
1977 |
82 |
21,894 |
24,480,124 |
1978 |
82 |
20,472 |
23,293,294 |
1979 |
92 |
18,799 |
23,312,933 |
1980 |
93 |
18,614 |
25,252,283 |
1981 |
94 |
17,781 |
26,105,665 |
1982 |
80 |
13,056 |
27,138,649 |
1983 |
85 |
12,575 |
27,427,318 |
1984 |
82 |
12,009 |
27,922,711 |
1985 |
130 |
13,573 |
27,306,787 |
1986 |
117 |
13,251 |
27,403,933 |
1987 |
166 |
15,116 |
28,160,396 |
1988 |
219 |
17,302 |
30,230,646 |
1989 |
203 |
16,825 |
32,848,446 |
1990 |
310 |
17,793 |
34,887,724 |
1991 |
304 |
18,155 |
38,476,859 |
1992 |
362 |
20,336 |
40,535,267 |
1993 |
400 |
25,956 |
43,271,706 |
1994 |
425 |
29,395 |
48,273,672 |
1995 |
487 |
36,495 |
53,827,580 |
1996 |
467 |
40,258 |
55,975,618 |
1997 |
455 |
39,395 |
58,122,510 |
1998 |
482 |
40,556 |
60,739,031 |
1999 |
506 |
52,444 |
62,625,937 |
2000 |
564 |
59,017 |
66,829,871 |
2001 |
671 |
67,604 |
71,212,470 |
2002 |
623 |
77,480 |
74,513,650 |
2003 |
542 |
79,211 |
75,623,184 |
2004 |
528 |
81,006 |
77,621,870 |
2005 |
601 |
85,440 |
80,462,795 |
2006 |
595 |
82,002 |
82,910,906 |
2007 |
542 |
77,338 |
86,183,629 |
2008 |
543 |
75,273 |
85,998,801 |
2009 |
551 |
78,293 |
88,758,396 |
2010 |
683 |
72,033 |
97,184,832 |
2011 |
683 |
70,527 |
113,553,806 |
2012 |
594 |
68,763 |
114,859,648 |
2013 |
579 |
67,037 |
115,823,338 |
2014 |
562 |
65,687 |
116,353,596 |
2015 |
555 |
61,735 |
115,229,390 |
2016 |
563 |
60,155 |
117,542,727 |
2017 |
558 |
56,022 |
120,870,409 |
2018 |
486 |
55,666 |
120,378,406 |
2019 |
476 |
51,642 |
119,887,424 |
2020 |
458 |
48,855 |
117,530,796 |
2021 |
444 |
38,261 |
63,849,466 |
Table current as of November 15th, 2021.
As can be seen, the number of samples is on a generally upward trend over time. The number of parameters and monitors varies as areas of focus change. While in any given year the most unique parameters reported is less than 700, the total number of unique parameters reported in all years is 1,177.
3.1.1 The significance of 1980
1980 marked a revision to the ozone monitoring program (44 FR 8202) that included implementation of revised monitor calibration procedures. Data from prior years is available but the user should understand that total uncertainty and spatial variability as artefacts of the measurements are higher than in later years. 1980 marks the beginning of nationally consistent operational and quality assurance procedures.
3.1.2 The significance of 1999
1999 marked the beginning of required PM2.5 (particulate matter of 2.5 microns in aerodynamic diameter or less) and PM2.5 speciated monitoring (62 FR 38652). PM10 and TSP data is available in prior years, but 1999 is the first year with national FRM and non-FRM PM2.5 monitoring. This is reflected in the large jump in the number of monitors in 1999.
3.1.3 Sample Durations
Each monitor reports data at a specific sample duration. The sample value is the average atmospheric concentration of the parameter in the time window beginning at the sample begin time and lasting for the sample duration.
Sample duration is not to be confused with a calculated temporal aggregation (8-hour NAAQS averages, daily summary, annual summary, etc.). EPA calculates many summaries (see the data handling, section below) at different temporal scales. Sample duration applies only to the data that is reported to EPA by the monitoring organizations. For example, 8-hour ozone averages are not referred to as “samples” since they are calculated from the 1-hour sample measurements. Summary (temporal aggregate) data is available at our system-defined calculation levels and are not included in the table below. Table 2 profiles how much data is available at the various sample durations.
Sample Duration |
Samples |
Percentage |
Latest Year Reported |
|---|---|---|---|
5 MINUTE |
233,823,871 |
7.59 |
2021 |
15 MINUTE |
879,049 |
0.03 |
2020 |
1 HOUR |
2,722,712,384 |
88.37 |
2021 |
2 HOUR |
10,111,581 |
0.33 |
2021 |
3 HOUR |
12,165,874 |
0.39 |
2021 |
4 HOUR |
205,895 |
0.01 |
2012 |
5 HOUR |
2,706 |
0.00 |
2012 |
6 HOUR |
10,435 |
0.00 |
2012 |
8 HOUR |
32,060 |
0.00 |
2021 |
12 HOUR |
106,704 |
0.00 |
2017 |
24 HOUR |
100,353,024 |
3.26 |
2021 |
1 WEEK |
96,796 |
0.00 |
2012 |
1 MONTH |
150,588 |
0.00 |
1996 |
3 MONTH |
15,952 |
0.00 |
1969 |
COMPOSITE DATA |
227,112 |
0.01 |
2021 |
INTEGRETED PASSIVE 2-WEEKS |
53 |
0.00 |
2008 |
INTEGRETED PASSIVE 3-WEEKS |
81 |
0.00 |
2008 |
INTEGRATED PASSIVE 4-WEEKS |
42 |
0.00 |
2008 |
Table current as of November 15th, 2021.
Highlights of Table 2 include the following: Beginning in 2010, 5-Minute duration SO2 data was required to be reported and it now ranks second in number of samples. It has grown quickly due to the relatively large number of samples reported per year. Hourly data is by far the most voluminous in AQS with over 2 billion samples. The 2- and 3-hour data is largely carbon speciation and ozone precursor data respectively. The third largest component is the 24-hour data as many particulate and toxics samples are reported at this duration and have been for a long period of time. Composite data are concentration values derived from two or more air samples obtained at different times that are analyzed together. These separate samples may span any time period from one week to one year. All such composite data is for total solid particulate (TSP) metal species.
3.2 Geography
In 2020, data was collected at 2,498 AQS sites. An AQS site is a distinct geographic location that has one or more monitors. Not every site measures the same parameters. The location of these sites within the continental United States is shown in Figure 1.
A dynamic map of sites in our major networks is also available.
Figure 1. AQS CONUS sites reporting data in 2020.
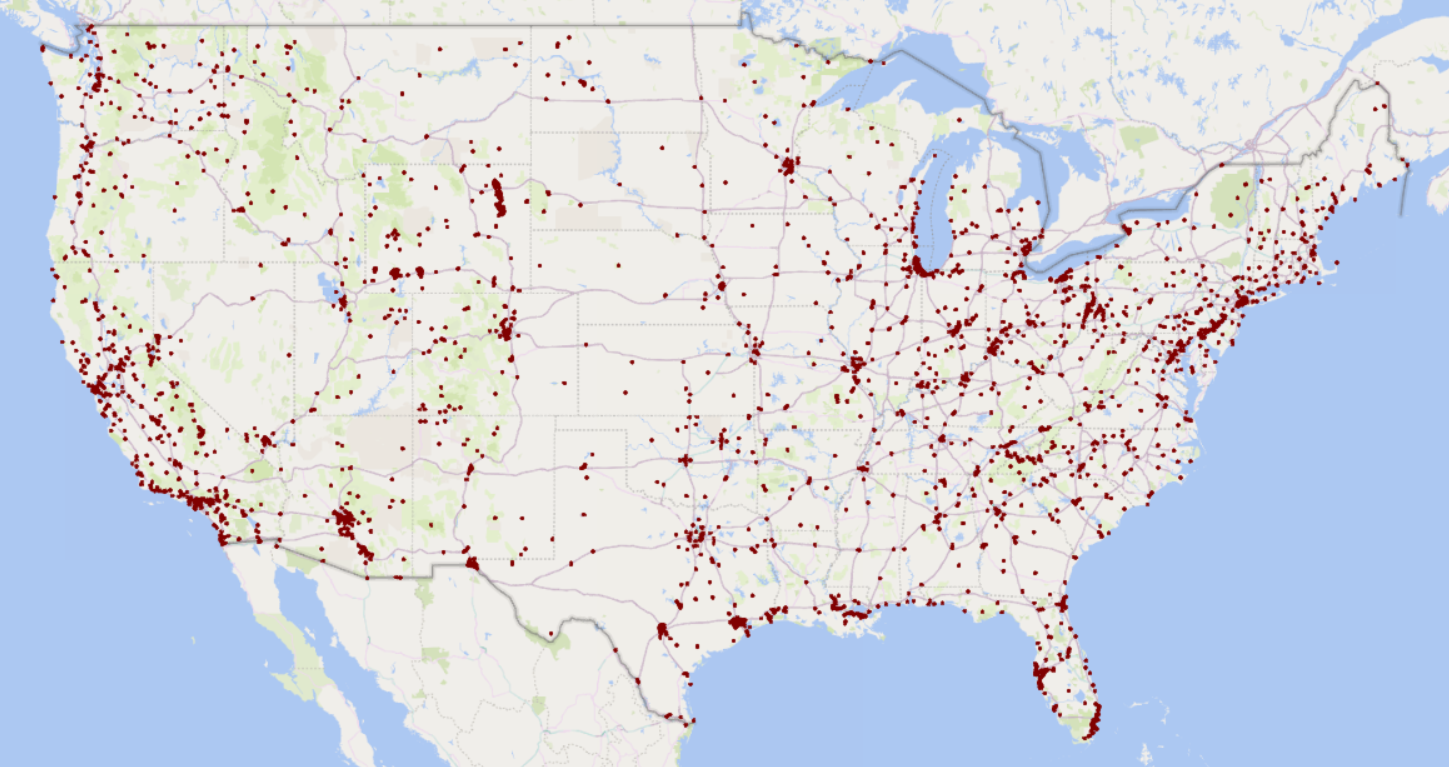
Not every county or zip code has an AQS monitor and AQS does not provide spatially interpolated data. If a site (monitor) is not in a particular location, AQS cannot provide data for that location.
3.3 Parameter
Measured entities in the AQS data set are referred to as parameters. (The terms “pollutants” and “substances” are not completely appropriate as some things measured are not pollutants, e.g., carbon, nor substances, e.g., wind speed.) See Table 1 for a summary of the number of available parameters by year.
The parameters in AQS are identified by codes that are specific to the AQS system itself. That is, we do not use Chemical Abstract Service or any other standard naming conventions. AQS parameter codes are 5-digit numeric codes. AQS also has parameter names that are domain specific and may or may not correlate to other taxonomies.
AQS also defines parameter classifications. These are groups of parameters that have been collected for ease of extraction from the database. Examples of parameter classifications are Criteria (parameters for which National Ambient Air Quality standards have been defined), Meteorological, Core HAPs (Core Hazardous Air Pollutants), etc. A parameter may belong to any number of classifications. Classifications are not defined by regulation or policy and may change at any time.
A caution to the data user: ensure you are selecting the correct parameters. That is, AQS contains particulate data speciated at different sizes, and one or more of these size cut-offs may include the same species. For example, Aluminum has been reported at four different size fractions, which in AQS is four different parameters.
Also, the same substance may have different parameter codes. Most notably, PM2.5 (particulate matter less than 2.5 microns in aerodynamic diameter) is a method specific parameter and is reported to and stored in AQS under different parameter codes depending on the type of method used to measure it.
4 Interpreting AQS Data
Any AQS data you obtain will be filtered by or include metadata that describes the sites, instruments, or measurements. The sections below describe key metadata elements that will help users select data or interpret data they have already obtained.
4.1 Networks
For administrative reasons, the monitors in AQS are divided into networks. Monitors in the same network use similar methods, operating procedures, and quality assurance assessments. While for some data users, the network to which a monitor belongs is important, for others it may not be. If a parameter is of interest, there is no reason to arbitrarily limit a data retrieval by network. The fact that our system holds data from several networks makes understanding the data somewhat more difficult (unlike, for example, the national weather service meteorological data which is consistent over time and place). Data in AQS are not all measured at the same frequency, using the same methods, etc.
4.2 Data Handling
40 CFR Part 50 expresses the national ambient air quality standards (NAAQS) for the criteria pollutants. The NAAQS generally have an averaging period (up to three years) of a particular data duration (1, 8, or 24-hour average). To make routine assessment and reporting of the data easier, AQS performs a series of data reduction and aggregation steps on each sample value as it is reported.
4.2.1 Data Reduction
AQS defines a standard unit of measure for every parameter. If the data is reported in a different unit of measure, AQS converts the sample value to the standard units. AQS then applies any data rounding or truncation rules associated with the method used to sample the data. Both the reported value and the standard value (with converted units and rounding rules applied) are stored in AQS. Generally, only standard values are available to the public as releasing data in mixed units of measure can be counter-productive.
In the past, AQS would replace the sample value with ½ of the Method Detection Limit (MDL) if the sample value was below the MDL. AQS no longer does this and historical substitutions have been removed. AQS does store sample specific MDLs where reported and the reference MDL for each method for use when the sample MDL is not reported. The user can make their own substitutions with this data, if desired.
4.2.2 Data Aggregation / Summarization
After the data reduction, AQS calculates and stores the following summary records for each monitor:
Any sub-daily averages required for NAAQS calculations. For example, 8-hour ozone averages are calculated from the 1-hour sample values.
Daily summary records for every parameter.
Quarterly summary records for every parameter.
Annual summary records for every parameter.
Each of these summary calculations is stored in the database. Each is created as soon as a single value for the summary period is reported. That is, the first value reported during a calendar year will trigger the calculation of an annual summary record for that year. Information about the number of samples and the completeness of data is included in each summary record so the user may determine if it is appropriate to use.
For Criteria pollutants (those for which a NAAQS has been defined), multiple summary records at each level may be calculated for each monitor. There are three reasons this is done. First, if the monitored data was affected by an event (q.v.) during the summary period, two additional summary records are created. One which excludes all data flagged as affected by the event by the reporting agency. Another which excludes this flagged data that is also concurred by EPA that it should be excluded from NAAQS calculations. These are differentiated in the data set by the “event type” associated with the summary. Second, when new NAAQS are promulgated, they usually include different data handling procedures (as described in the relevant appendix of 40 CFR Part 50). AQS maintains the summaries calculated using the data handling rules for prior standards for historical and legal reasons. These are differentiated in the data set by the “pollutant standard” associated with the summary. Third, if the form of the NAAQS has multiple durations (e.g., 1-hour and 8-hour), a summary will be calculated for each of these durations. These are differentiated in the data set by the “duration”. This can lead to peculiar results. For example, since AQS now stores data for 3 ozone standards (those promulgated in 1997, 2008, and 2015), there are potentially 3 (for events) x 3 (for standards) x 2 (for durations: 1-hour and 8-hour) = 12 daily summary records calculated for each monitor for each day. Most AQS data products have filtered this data to include only what is most recent or what we think is most relevant. If you cannot find what you need, please contact us (link at bottom of this page).
AQS does not calculate monthly summary records (except for lead data, as monthly means are required to properly calculate an annual summary in the form of the NAAQS). If the user desires monthly aggregate data they must calculate it themselves from the daily summary or sample values.
If the parameter has a NAAQS in the form of a 3-year average, AQS also calculates a design value summary record for the monitor. (Note, this is done on demand rather than when the data is submitted.)
Details of how the values are aggregated/calculated can be found in the AQS Data Dictionary on our documents page. Information about what metrics are available at each summary level can be found in the documentation for the specific format of the output/report at the data access site being used.
In general, EPA considers a summary data calculation to be “complete” if at least 75% of the data expected to be available at the more discrete temporal level is available. For example, an annual summary of hourly data is complete if 75% x 8760 = 6570 samples are available. Likewise, an annual summary of quarterly data is complete if 75% x 4 = 3 quarterly summaries are available. There are exceptions to the 75% threshold and a summary value may be “valid” if, for example, certain concentration levels are exceeded, regardless of the data completeness. The AQS Data Dictionary describes validity indicators for each summary level and parameter and the data set contains a validity field for each.
4.3 Data Collection Methods
4.3.1 Continuous and intermittent methods
Sampling methods may be grouped into two categories based on the measurement technology: continuous and intermittent. These categories explain some of the temporal patterns in the data set.
Most of the data in AQS comes from monitors using continuous methods and is reported to EPA as an hourly average (with the sample duration of 1-hour). Continuous methods are those that can take an instantaneous sample of data in the field. There are continuous methods in use for inorganic gases, particulate matter and meteorological parameters. The time series data from continuous monitors is also usually continuous: there is a sample for every hour of the year. This excludes times the monitor may be down for maintenance, quality assurance activities, or events (q.v.).
Many of the samples of particulate matter and toxic substances are measured using intermittent methods. These are also known as manual methods. This is because the instrumentation is operated such that some physical maintenance must be done on the monitor between samples (the sampling medium must be isolated - filters or cannisters replaced, etc.). Some of these maintenance operations have been automated, but the methods are still considered intermittent. Data from intermittent methods may have one or both of the following differences from continuous data.
First, intermittent data usually has a longer sample duration. Rather than 1-hour, the duration is usually 3-hours or 24-hours (but may be other values as well). This is the length of time the instrument samples the atmosphere before the medium is analyzed.
The second pattern intermittent data may display is that there may be time gaps between samples. That is, a 3-hour sample may be taken once per day. Or a 24-hour sample may be taken on 1 day in every 3 days. Our regulations require, based on a variety of factors, that 24-hour intermittent samples be taken every day, every 3 days, every 6 days, or every 12 days. Thus, a particulate matter monitor may only have data in AQS for 1 in every 6 days. This data is 100% complete as it meets the sampling and reporting requirements. Each intermittent monitor has a sampling schedule with a frequency of sampling described in its metadata.
4.3.2 Federal Reference Methods and Federal Equivalent Methods
Methods are also categorized by whether they are federal reference methods (FRM), federal equivalent methods (FEM), or neither (Non-FRM).
Methods are designated as FRM or FEM after passing tests outlined in 40 CFR Part 53. Any method that is not an FRM or FEM is usually referred to by EPA as “Non-FRM” (which really means not an FRM or an FEM)
These distinctions are important to EPA in that certain actions we take are to be informed only by data from FRMs and FEMs. It is up to each user of the AQS data set to determine if the data is of sufficient representativeness for use in their application.
It should also be noted that FRMs are not available for every parameter.
5 Samples and Their Metadata
Data submitters report sample values (also called “raw data”) to AQS. These sample values are always averaged to a particular “sample duration” before reporting. Nominally, continuous data is reported to EPA as 1-hour sample values. These values are the 1-hour average values calculated by the sampling instrument that takes many samples during the hour. The averaging methodology will be described in the equipment’s operating procedures or the submitter’s data Quality Assurance Project Plan. EPA requires some SO2 data to be submitted as 5-minute averages (this is currently the shortest duration data in AQS). Many filter-based methods report their data at a 24-hour duration (air is drawn continuously over the filter for 24 hours and the filter is then collected and analyzed/weighed).
The key point is that data may be reported to AQS at any duration. Data for the same parameter may be reported at different durations. The most common durations are 1-hour and 24-hour and 24-hours is the longest allowed observed duration. Because of this, the most discrete time interval you are guaranteed to find any data is daily. (And as discussed in the “intermittent methods” section above, a monitor may not be required to report every day.)
The time stamp on sample data is always the sample begin time. Also, all sampling times are scheduled in local standard time (e.g., there is no adjustment for daylight savings time). Some output formats include a GMT time stamp as well. Thus, the sample represents the average concentration measure from the sample (begin) time lasting the length of the sample duration. For example, an 8 am sample with a 3-hour duration represents the average atmospheric concentration from 8 am – 11 am local standard time at the probe.
Since a 24-hour sample is equivalent to a daily aggregate, if you are interested only in daily data, it is easier to consider daily summary data than sample data.
5.1 Sample vs. Sample Measurement
There can be confusion around the term “sample”; here is how we use it in various contexts.
Some measurement methods require a sample of air to be sent to a lab for analysis. In most cases, many substance concentrations will be measured from this one sample. For example, a sample may have several dozen toxic concentrations determined with the aid of a gas chromatograph. Each of these is called a sample measurement in AQS and is stored as a discrete value - for the concentration of each substance.
Conversely, for continuous, in-situ monitors, the AQS reporting requirements may specify a 1-hour average sample measurement be reported. To obtain this 1-hour average sample measurement the monitor may measure the concentration of the substance in the atmosphere 3 or 12 or dozens of times during a 1-hour period. The on-site data handling equipment calculates a 1-hour average concentration which is reported to AQS as a single sample measurement. In this case the 1-hour “sample measurement” value is an average of many individual samples.
In conversation, writing, and data “sample”, “sample measurement”, and “sample value” are often used interchangeably and the author’s intent must be determined from context.
5.2 Null Samples
If a monitor is scheduled to collect data and does not (e.g., it is down for maintenance), the operator is supposed to submit a null data reason to AQS. This is a placeholder to let EPA know that more data will not be forthcoming. These null samples do not contribute toward data completeness and are not included in some public reports and files.
5.3 Acceptable Values
AQS does place absolute limits on the values that can be submitted. However, these are fairly liberal limits, generally reflecting the theoretical limits of the measuring instrument or parameter plus or minus any reasonable uncertainty. This means, that for many parameters, negative values are acceptable.
5.4 Events
An “exceptional event” is something that affects the air quality that the State is not responsible for. That is, the air quality control agency could not have prevented it. A wildfire is the common example. If a fire affects a sample value, the State can flag it as an event. They then submit a demonstration to the EPA showing that the event did affect air quality. If the EPA agrees, these values are excluded from legal issues (primarily determining if an area is in compliance with the NAAQS standards). That is, EPA will not penalize a state for events beyond their control even if they exceed the NAAQS. (This definition has changed slightly over time and this describes the current situation. The concept of an event has stayed relatively consistent while the threshold for demonstration has changed to be more formal). Fireworks are another example of an event. Any sample value affected by an event will be “qualified” as such with a flag (a code indicating the type of event). Any summary calculation made by EPA will be done multiple times, including and excluding events. The complete list of qualifiers (including events) is available. Flagged observations are not “bad data”, they are quality assured measures of the air quality that are not used for legal reasons between the state and EPA. They do represent an actual air sample. Whether to use this data depends on the kind of analysis being done and is up to the investigator.
5.5 Exclusions
Monitoring regulations also allow for operators to request that data from a particular monitor be excluded from use in determining compliance with a NAAQS. If EPA has concurred with this exclusion, the monitor metadata will indicate the time period and standard from which EPA will exclude data. This is usually done if a monitor that would otherwise be used for NAAQS purposes temporarily does not meet a siting or operational requirement of the regulations. Sample data will be flagged and summary data will include or exclude this data in the same way event-related data are treated.
6 Sites, Monitors, and Collocation
Monitor locations are determined in a cooperative process beginning with federal minimum siting requirements followed by state, local, and tribal monitoring plans which are submitted to the EPA. The goals of monitoring vary by network and parameter (for example, a monitor may be sited to provide population exposure, determine background pollution levels, for pollution source surveillance, make near roadway assessments, meet permit requirements, etc.). EPA attempts to minimize unnecessary movement of monitors or interruption of long term time series of data as much as possible.
For the purposes of AQS, a monitor does not refer to a sampler or other specific piece of equipment. Instead, it reflects that a given parameter is being measured at a given site. That is, if a single cannister sample (from one sampler) is analyzed for 42 different parameters, then AQS considers that to be 42 different monitors. This convention was adopted by AQS as a data management strategy for handling the multiple time series of parameter data generated by the sampler.
Also, if a parameter is measured by more than one instrument at a site, the site is said to have collocated monitors for the parameter. When considering data from collocated monitors, it is up to the investigator to determine which data to use or how to combine it. For particulate based criteria parameters, 40 CFR Part 50 (Appendix N section 3.0(d)(2) for PM2.5 and Appendix R section 3(d)(ii) for lead) defines procedures on how to combine data into a single site-level value from collocated monitors.
7 Data Reporting and Ownership
The vast majority of data at the US EPA is collected, quality assured, and reported by state, local, and tribal agencies. Without the hard work and dedication of employees of state, local, and tribal agencies, AQS would have no data at all. The number and type of operational difficulties they encounter in collecting, analyzing, and reporting the data are beyond reckoning and EPA greatly acknowledges their contribution to this (their) data set.
Only in extenuating circumstances (or at the request of a submitter) will the EPA change data that has been submitted. An example of an extenuating circumstance is that a method has been shown to be insufficient for characterizing a certain parameter. In such cases EPA has moved the data to a more appropriate parameter (e.g., the same parameter with an “unverified” or “not quality assured” proviso.)
7.1 Timeliness of Data
AQS has a nominal quarterly reporting deadline. Data must be reported by 90 days after the end of the calendar quarter in which they are collected. For example, data from January through March is due by June 30. Data for most toxics, volatile organic compounds (VOCs) and some other data from Photochemical Assessment Monitoring Stations have a deadline of 180 days rather than 90. Most submitters do not wait until the deadline to report data and the influx of data into AQS is relatively continuous with minor spikes before the quarterly deadlines.
Historical data can change at any time. Many quality assurance review processes are made on an entire year’s worth of data, so it might not be until the middle of this year until the final review and changes have been made to last year’s data by a submitter. Also, historical monitoring or calculation methods may be found to be problematic and require that older data be changed. Finally, there is no “versioning” or freezing of data in the Data Mart, so if other people may need the data exactly as it was retrieved to verify or continue an analysis, the user must preserve a copy.
Real time data (data collected today) is not available from AQS. If real-time information is needed, please visit the AirNow API site and direct all questions there.
7.2 Important Annual Milestones
Required data (not voluntarily reported data) must be certified complete and correct by the submitting agency by May 01 of the calendar year following the year in which it was collected. This will often result in the resubmission, flagging, etc. of data collected and reported during the prior calendar year just prior to the May 01 deadline. Even though these are regulatory deadlines, AQS does not prohibit the addition, altering, or removal of old data by the submitters. There have been cases where data five or more years old has been altered as reanalysis, audits, etc. have shown it needed revision. All data in AQS is stamped with a “change date” to indicate the last time it was altered. Note, however that this date will reflect changes other than the data value. A common occurrence is that a submitter realizes the collection method or the method detection limit for a sample value is incorrect and will update just that field. This will update the “change date” for the sample since method information is critical metadata for the sample.
8 Caveat Emptor
Both the regulations referenced and the data system described here are subject to revision at any time. If there are any differences between this document and extant regulations and system descriptions, the latter should be considered authoritative.
EPA has data handling policies in place on our use of data based on the methods, exclusions, events, completeness, quality assurance, etc. It is up to each individual data user to determine which data they can use and how they can use it. We will not advise you on analysis methods or defend your methods.
9 References
Fann N, Wesson K, and Hubbell B (2015) Characterizing the confluence of air pollution risks in the United States. Air Quality, Atmosphere & Health; doi: 1007/s11869-015-0340-9.
United States Clean Air Act (1970)
40 CFR Part 50 (2015)
40 CFR Part 58 (2015)
44 FR 8202 (Feb 8, 1979), Revisions to the National Ambient Air Quality Standards for Photochemical Oxidants
62 FR 38652 (Jul 18, 1997), Nation Ambient Air Quality Standards for Particulate Matter
10 Contact
For any questions about the data or suggestions for this page, please mailto:aqsdatamart@epa.gov[email the AQS Data Mart team].